Guided Project | Microsoft Power BI + Maven Analytics
This project was part of a guided learning experience through Maven Analytics, where I built an interactive sales dashboard using Microsoft Power BI and the AdventureWorks dataset.
It’s a hands-on example of how I take raw data and turn it into something people can actually use to answer questions, spot trends, and make smarter business decisions.
🧠 What I Worked On
Power BI for the full BI workflow — from connecting raw CSVs to designing clean, interactive visuals
Data modeling — built relationships between customers, products, sales, and regions
DAX measures — used time intelligence and custom calculations to dig deeper into the data
Visual storytelling — designed intuitive dashboards with slicers, KPIs, drill-throughs, and more
🔍 What You’ll Find in the Dashboard
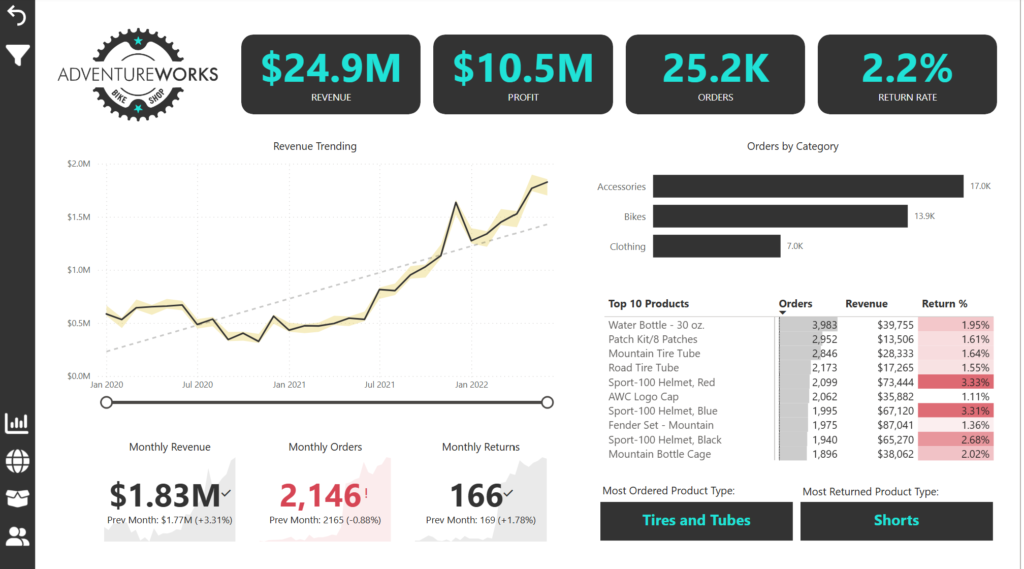
Sales Overview Track revenue, profit, and order trends across time and categories.
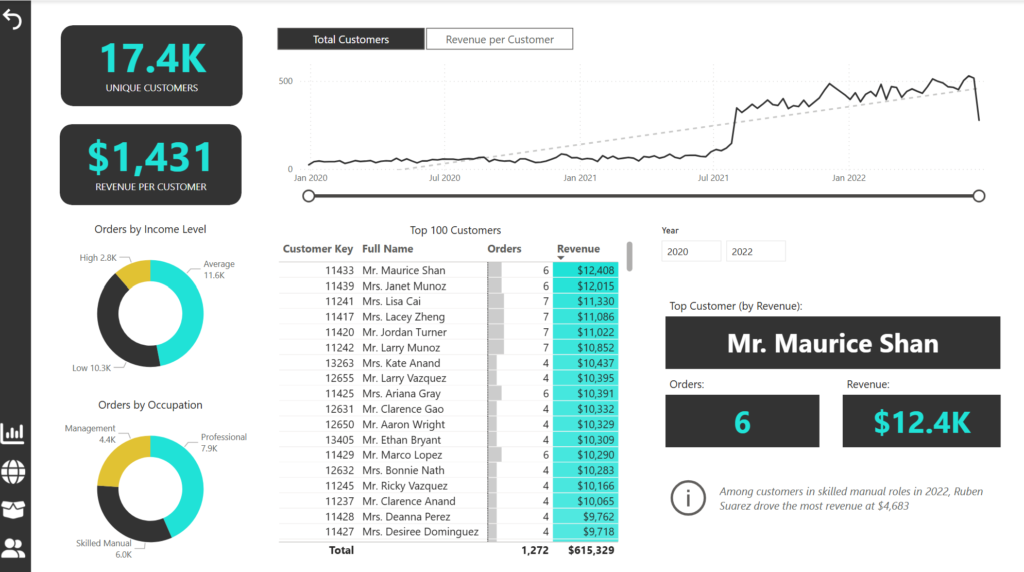
Top Customers & Regions See who’s buying the most, and where they are.
Customer Insights Break down demographics and buying behavior to spot patterns.
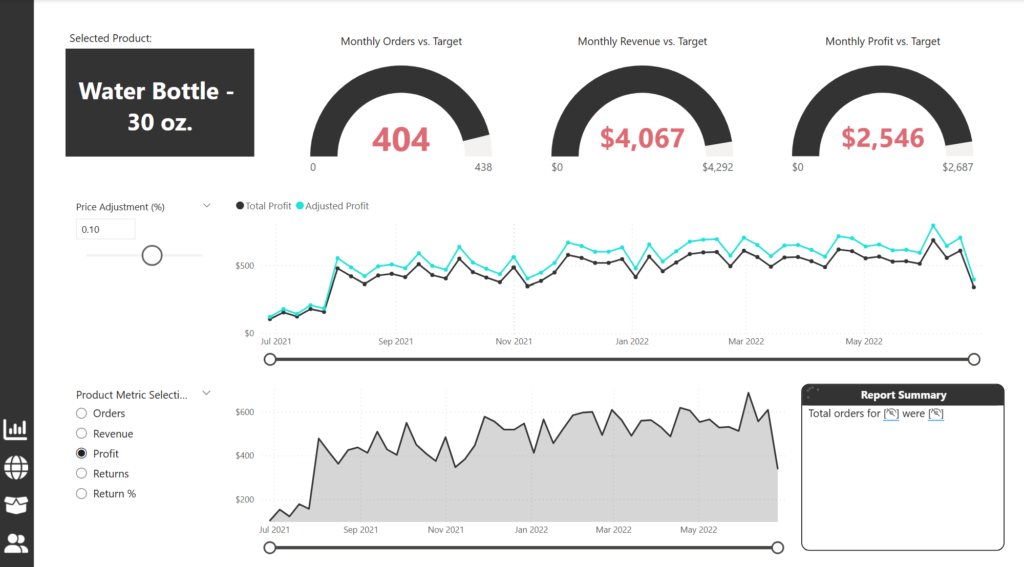
Product Performance Discover what’s selling, what’s not, and where there’s room to grow.
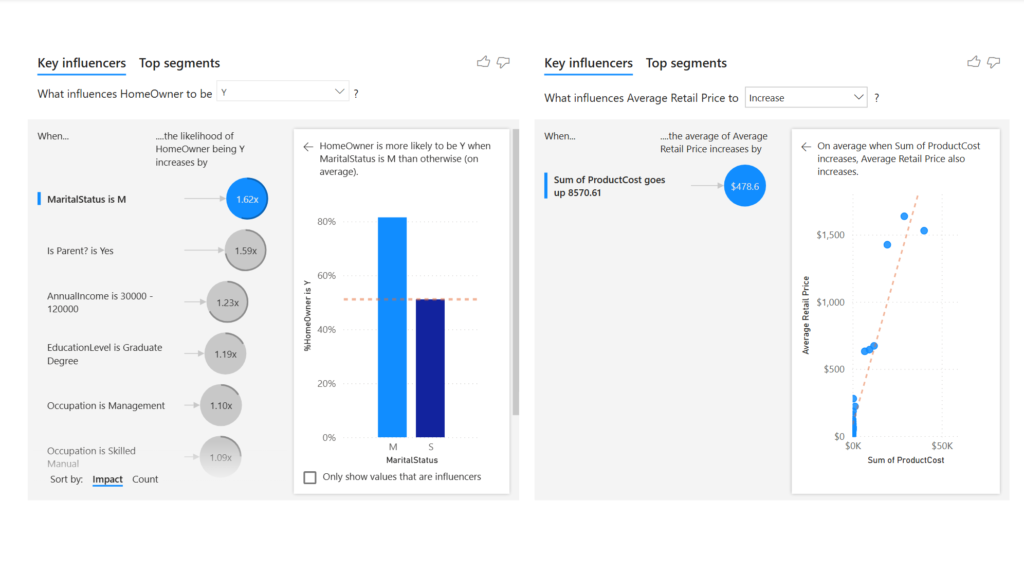
Decomposition Tree & Key Influencers Dive into what’s driving sales and what factors are influencing customer decisions.
💡 Why It Matters
This dashboard gives a well-rounded look at sales and customer behavior, helping teams make better calls on where to focus, what’s working, and where they can improve.
For me, it was a great chance to sharpen my Power BI and DAX skills while building something that tells a clear story with data. I love these guided projects, as they usually can help me apply a specific skill or visual to my personal projects.