Full-Funnel Sports Analytics
Case Study
Building analytics for a league
that doesn't exist yet.
A startup professional sports league faces an analytics challenge that's different from an established property. There's no historical baseline, no inherited infrastructure, and no analytics team to hand off to. Everything has to be built from raw data with no prior context.
The questions a startup league actually asks are harder than they look: Where are our fans? Which markets are worth activating? Are we saturating our email list before we've earned the engagement? Which ticket buyers will come back, and which were one-game curiosity?
This project was built to answer all of those questions simultaneously — not as a series of disconnected reports, but as a unified analytics ecosystem where every insight layer feeds the next one. Fan segmentation informs email strategy. Email performance informs digital investment. Digital behavior informs market expansion priorities.
The goal wasn't to build dashboards. It was to demonstrate how I think when standing up analytics for a new organization — what to build first, what questions matter most, and how to connect technical outputs to business decisions.
Analyst, architect,
and product owner.
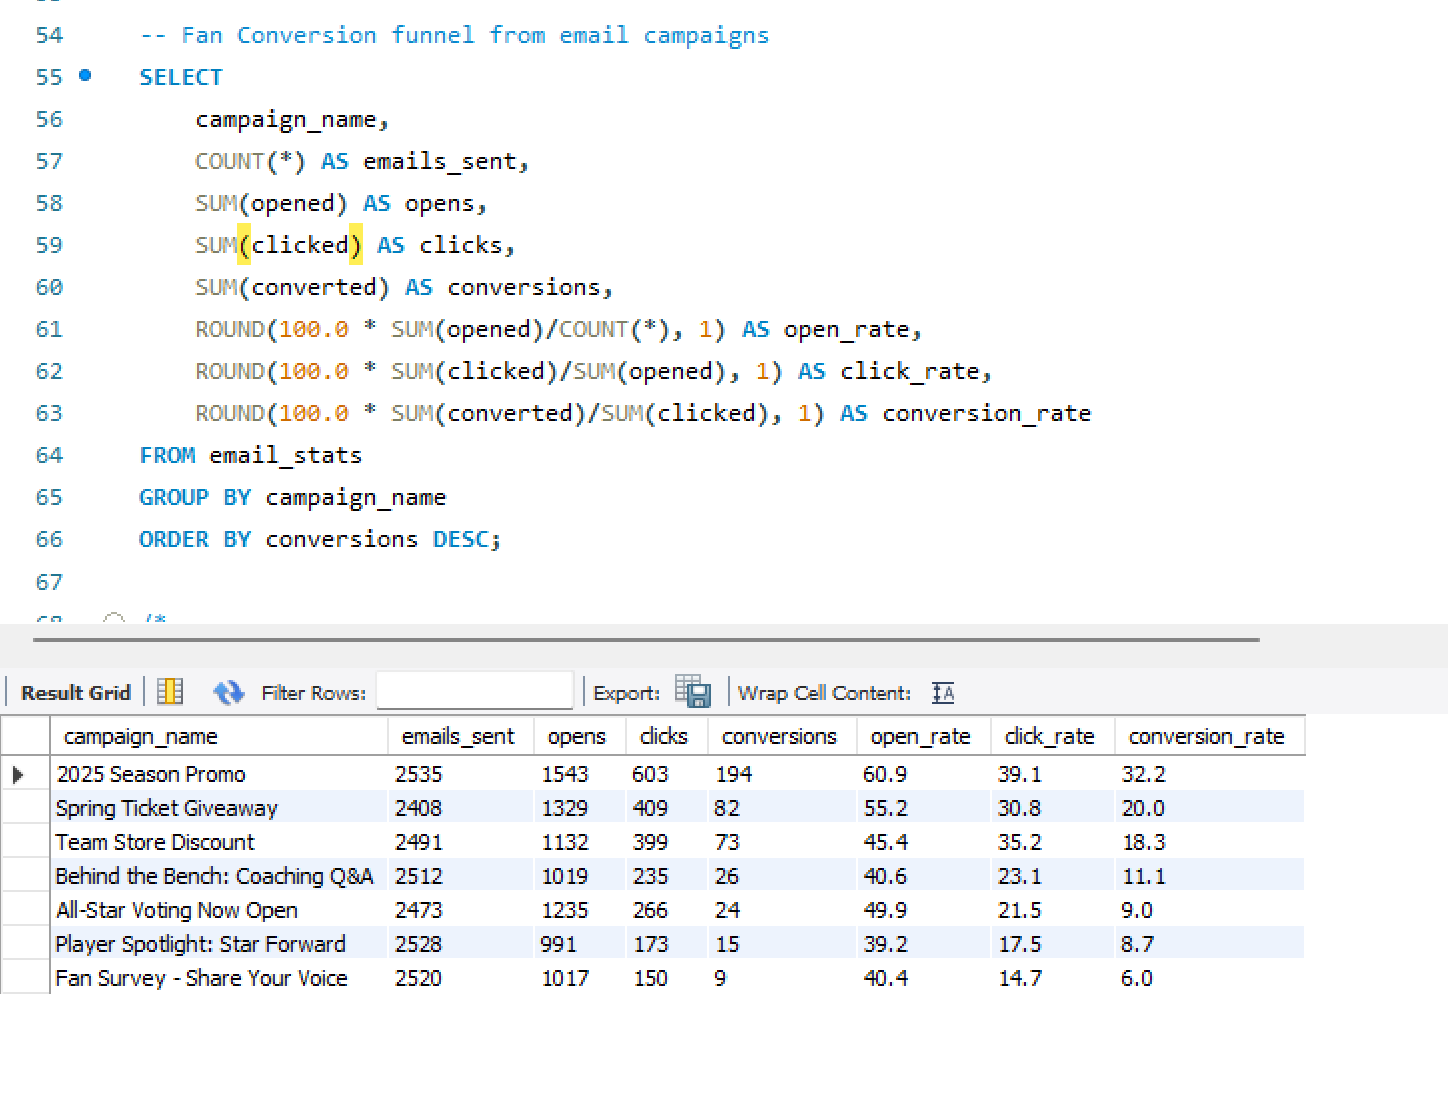
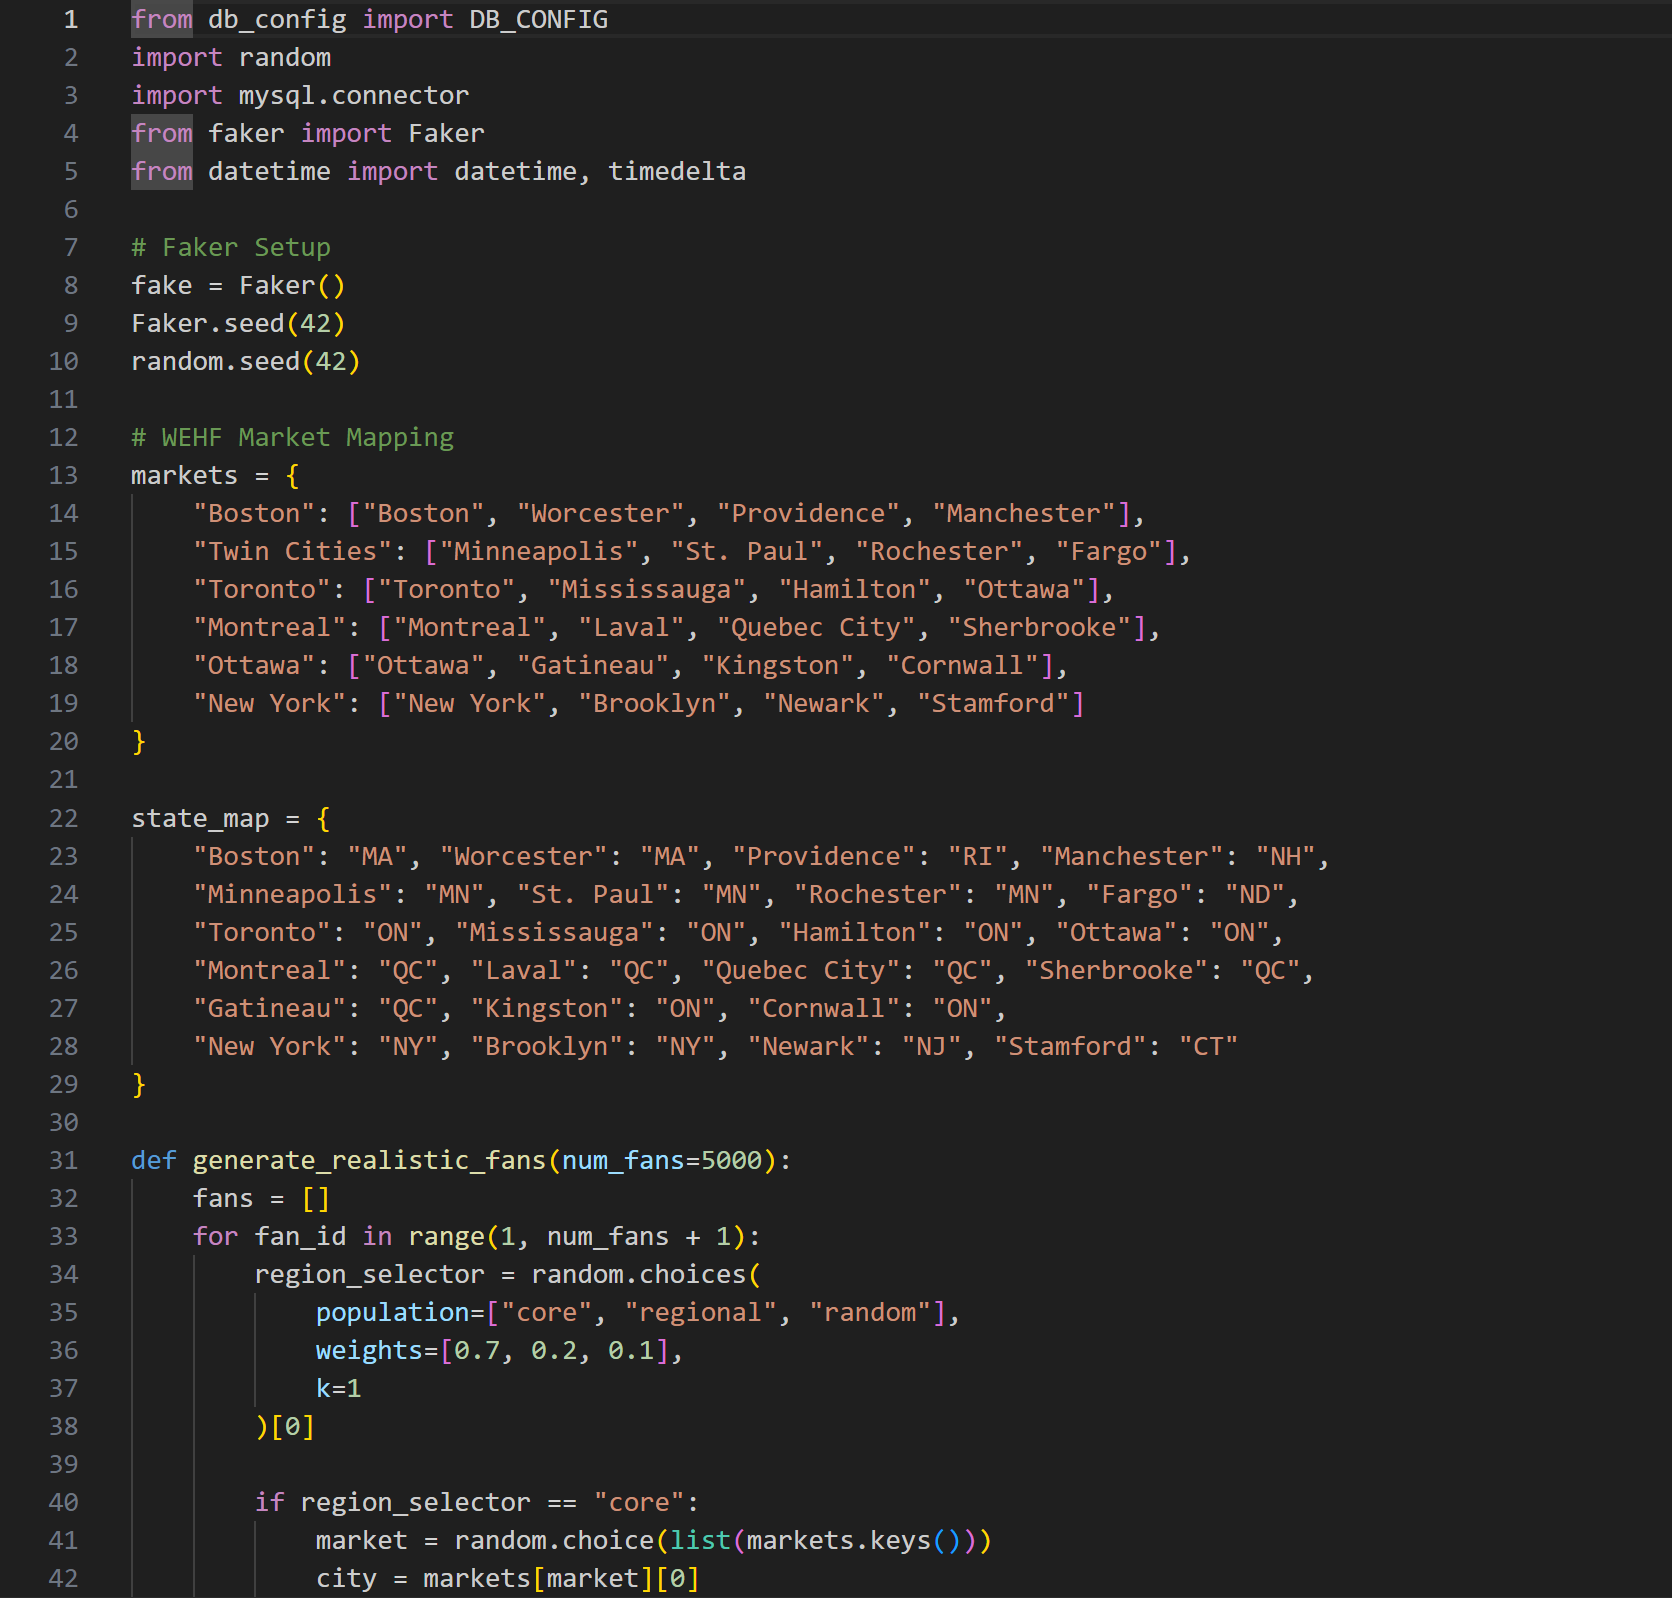
- Designed and built the SQL data warehouse — relational tables for fans, ticketing, email campaigns, web traffic, and merchandise with realistic geographic distribution across simulated league markets
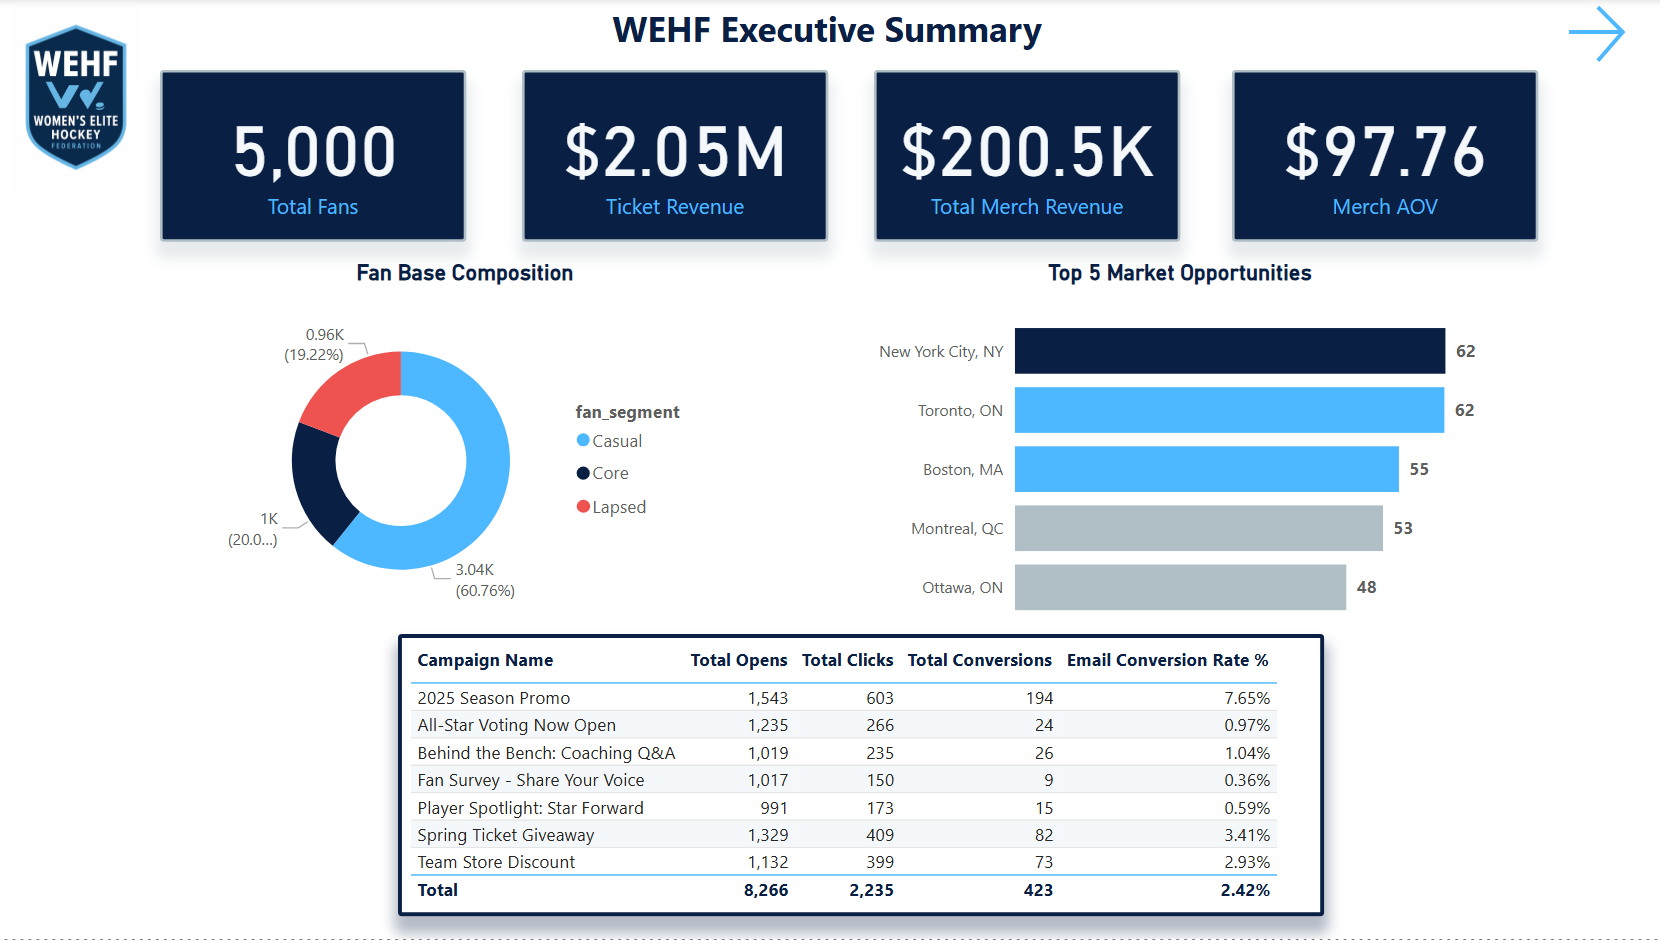
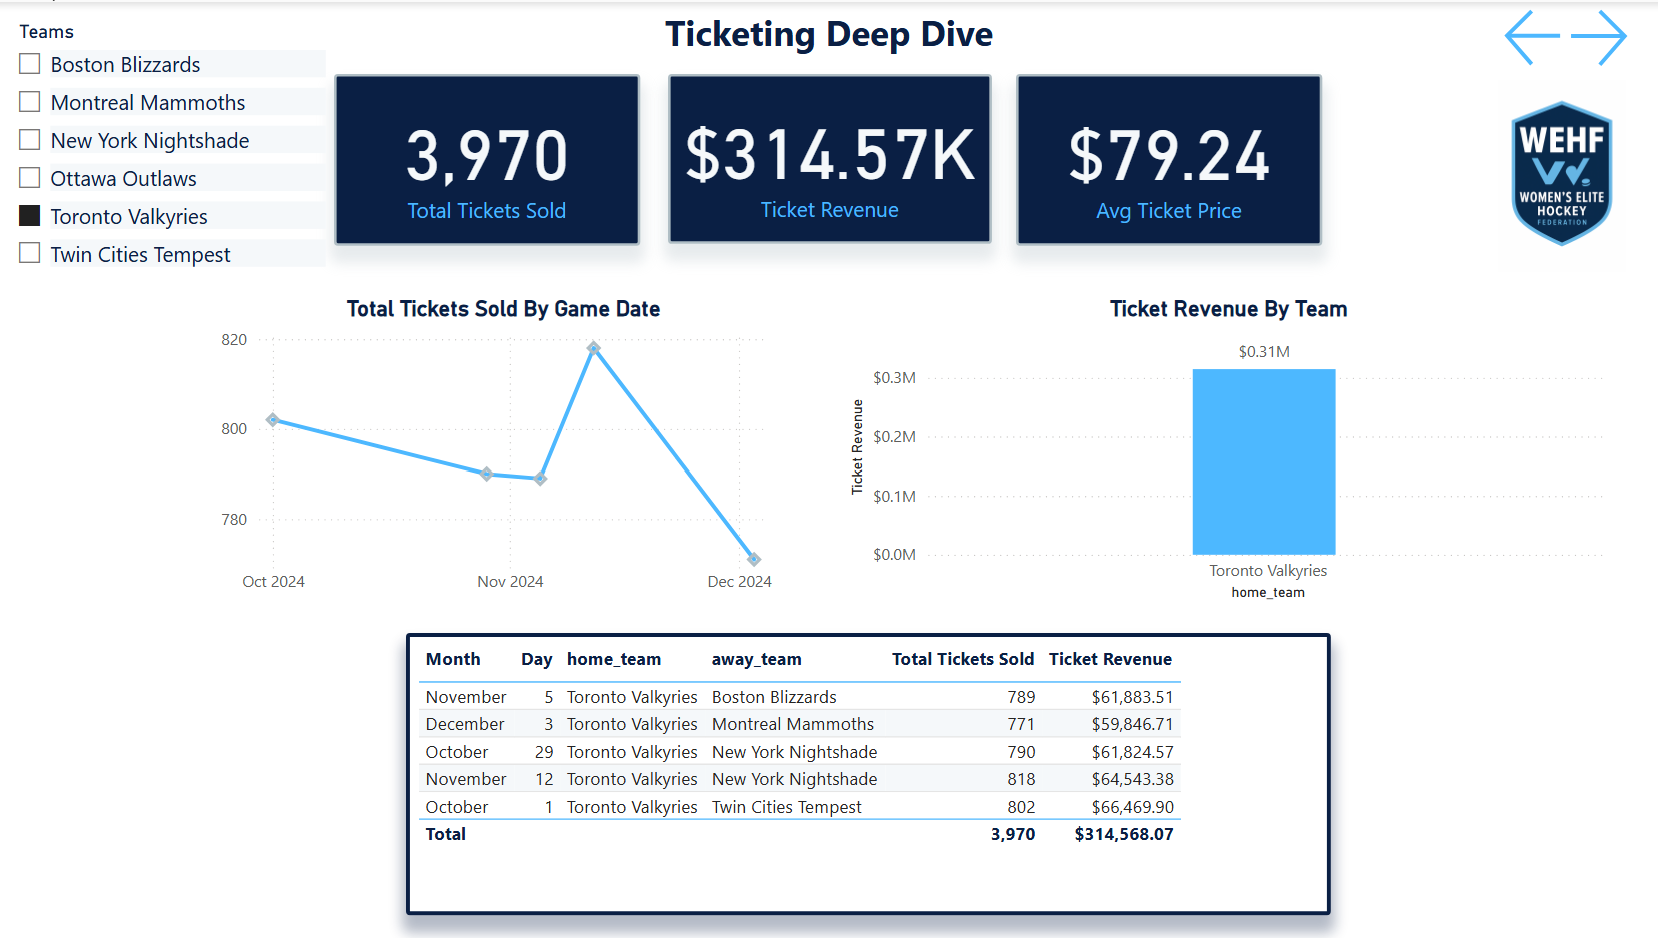
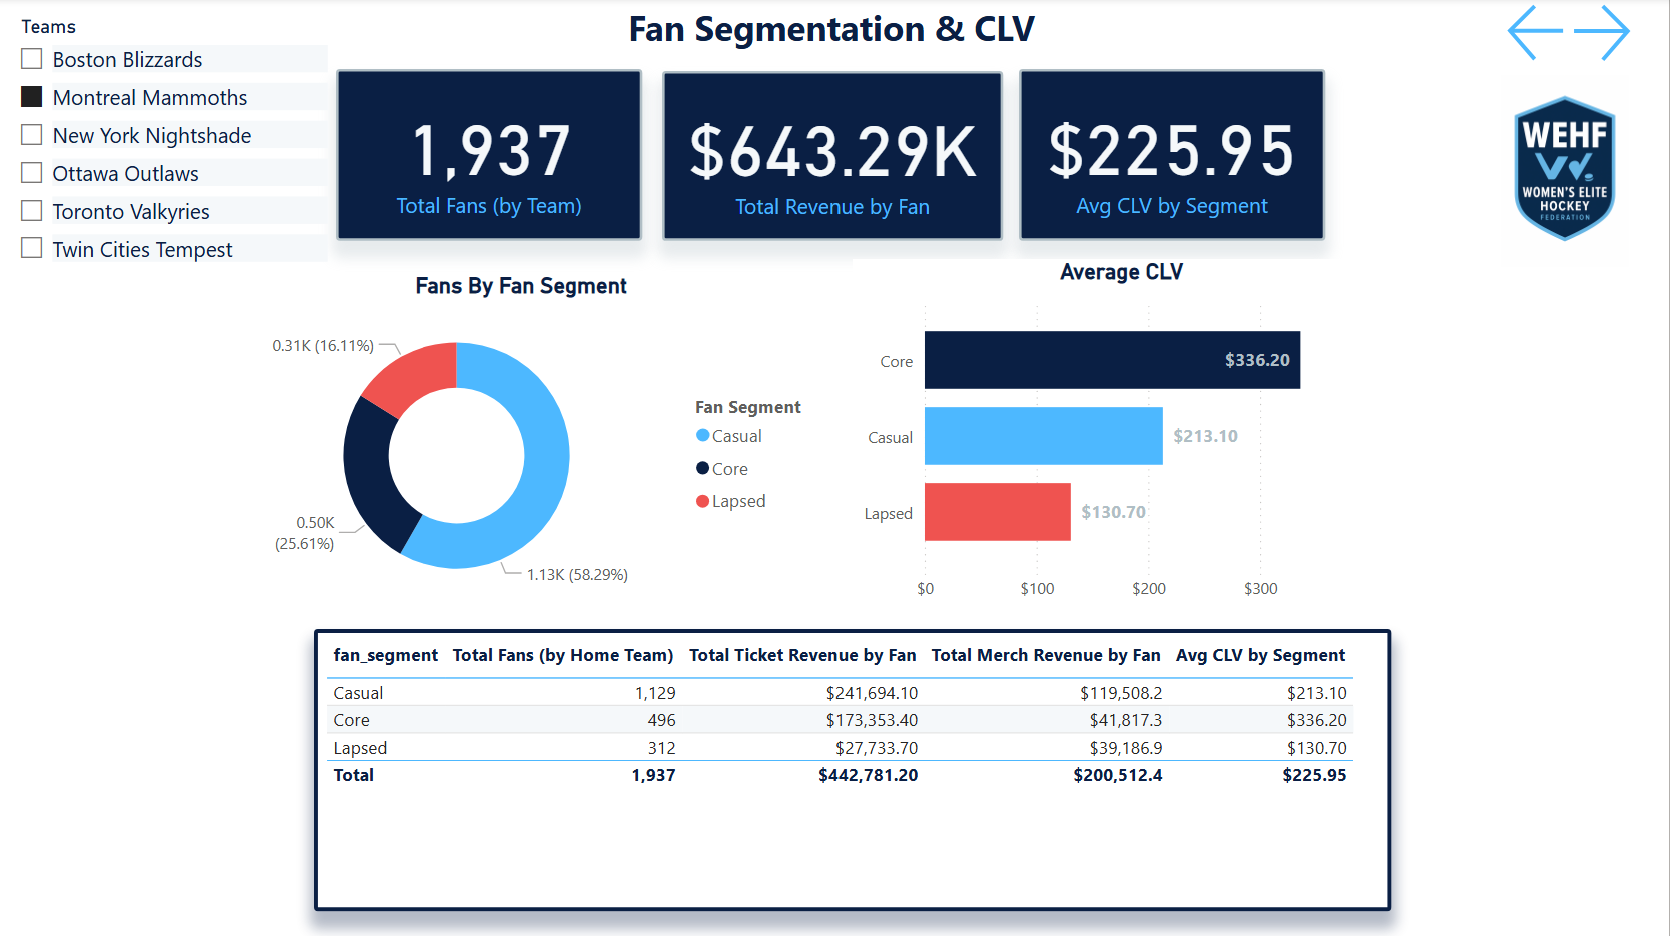
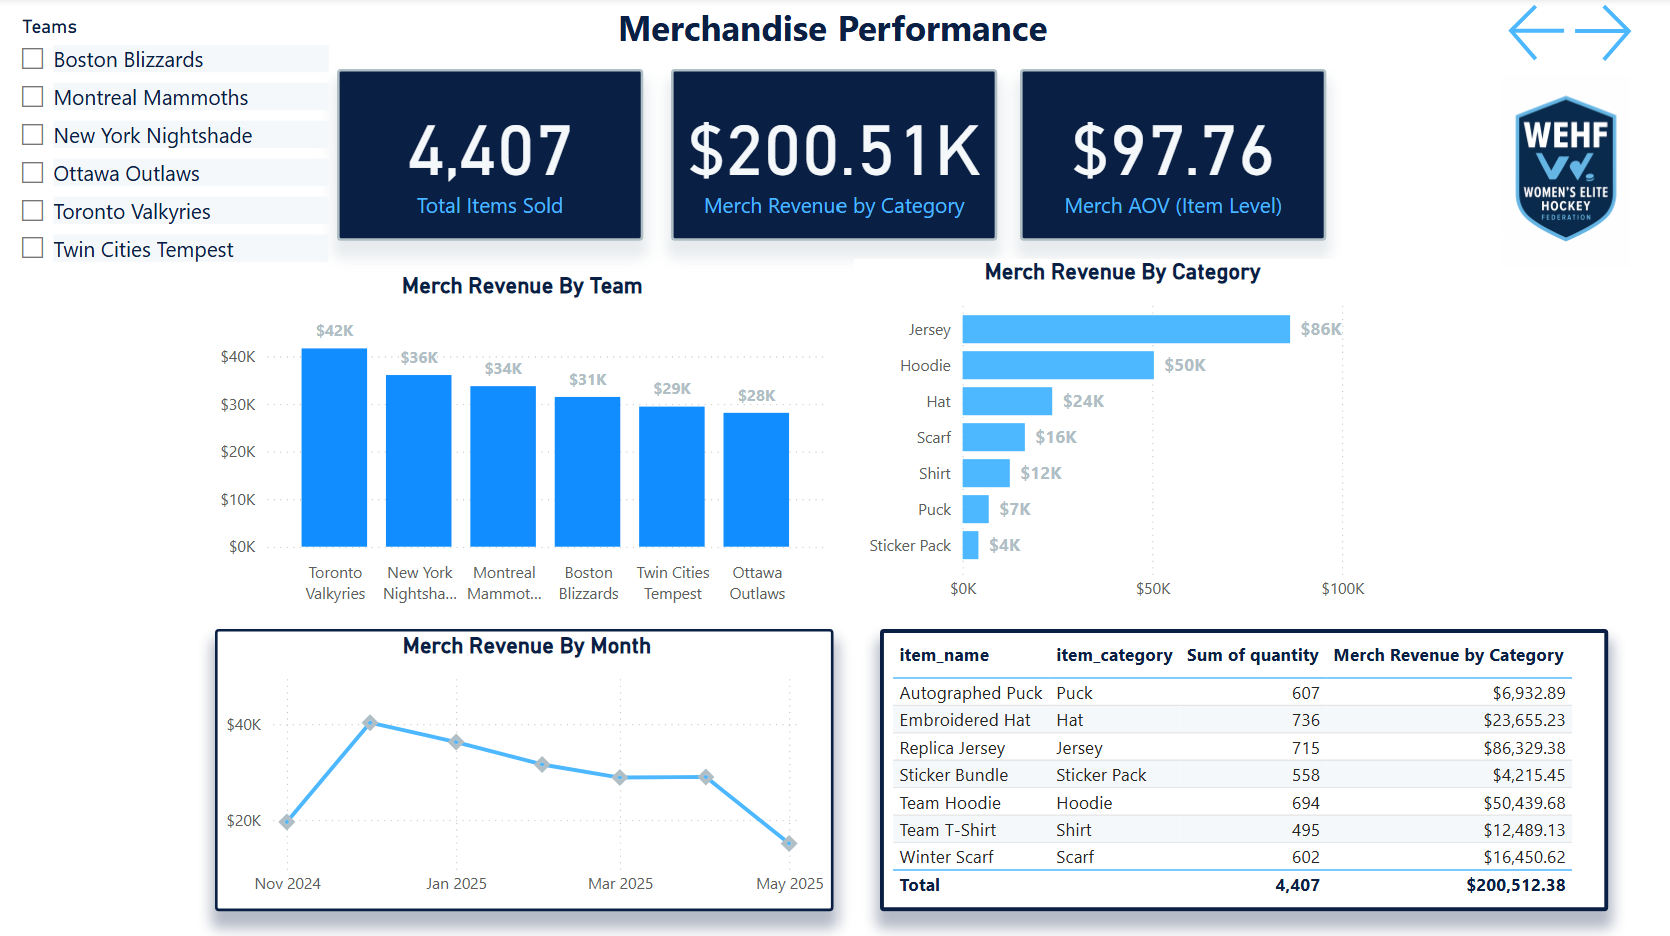
- Built a 7-page Power BI dashboard suite — Executive Summary, Ticketing Funnel, Fan Segmentation, Email Performance, Web Behavior, Merchandise, and Market Expansion
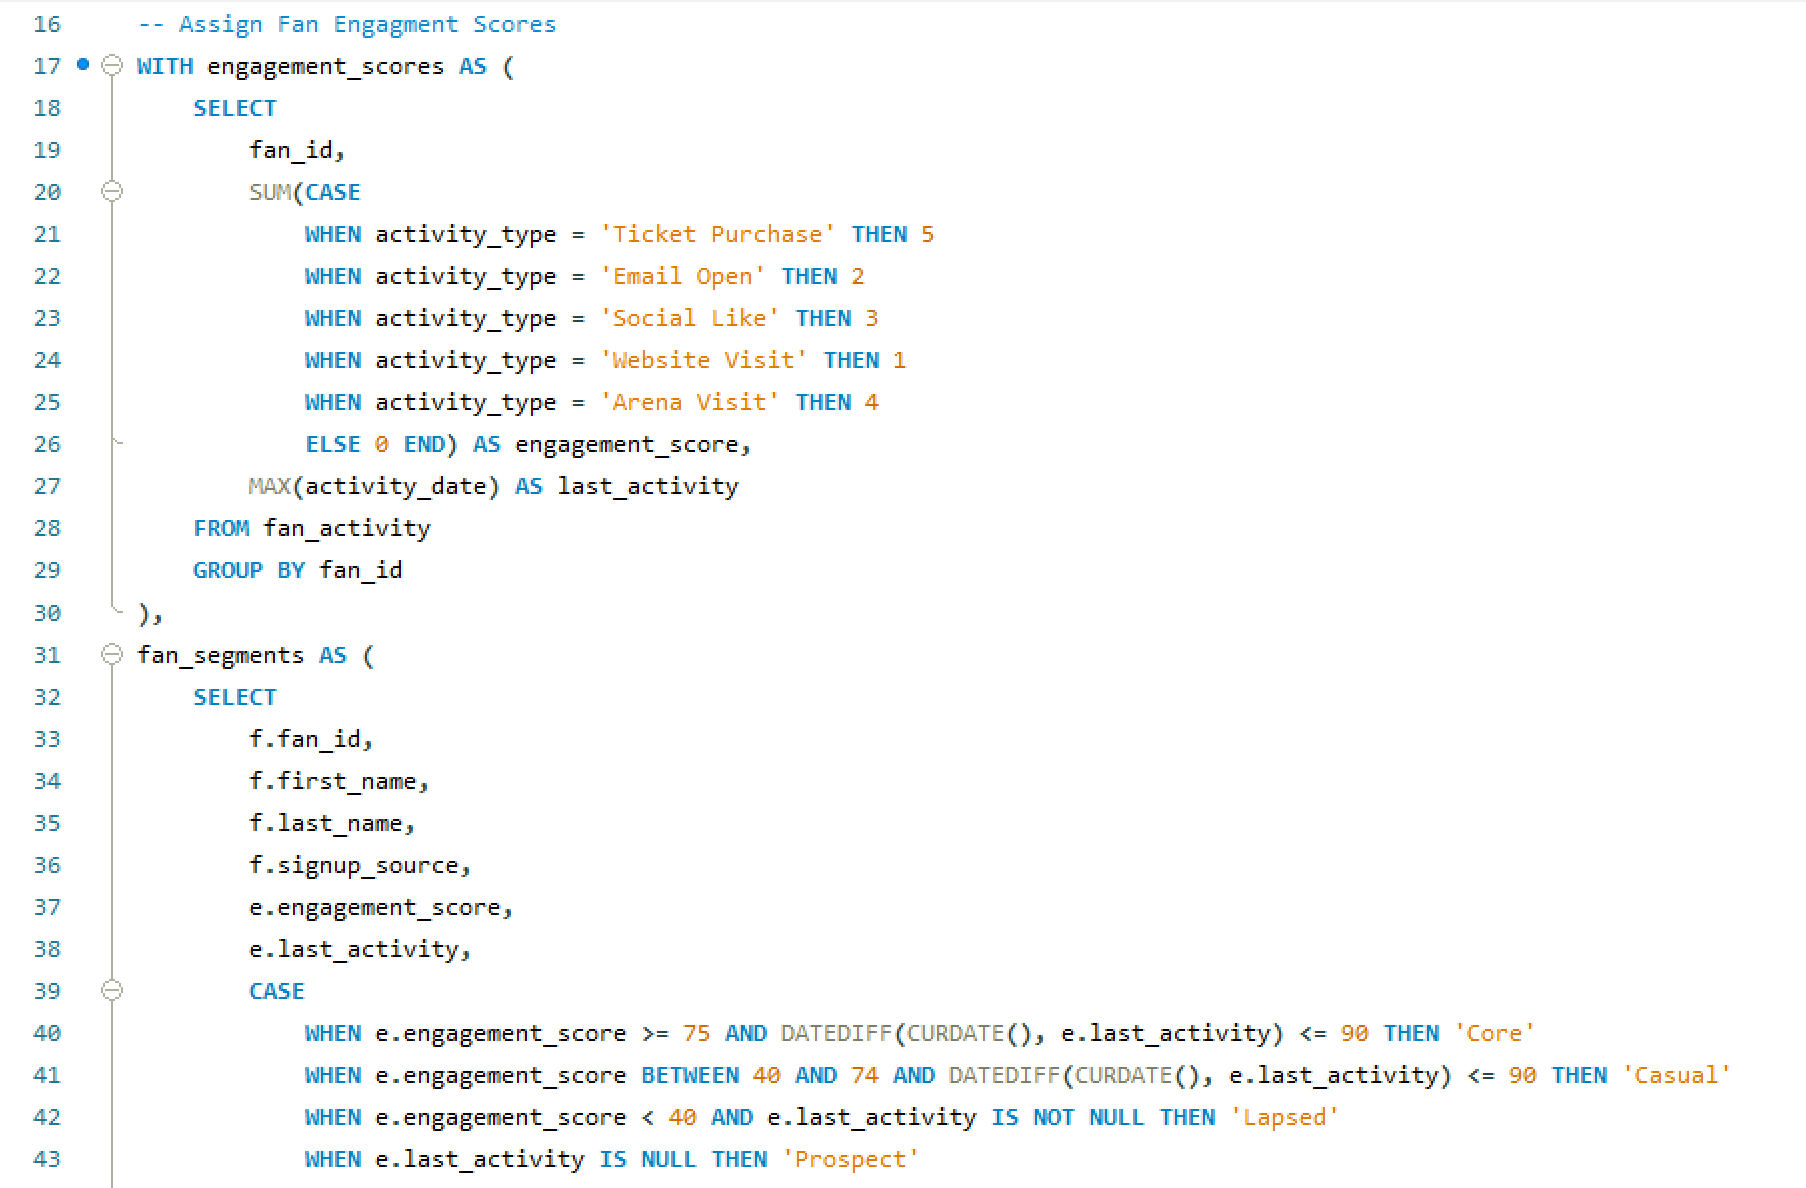
- Created all DAX measures — lifetime value metrics, renewal rate analysis, email campaign scoring, and web session flow logic using custom measures built from scratch
- Simulated realistic fan data — behavioral distributions, purchase patterns, geographic concentration, and data imperfections that mirror real startup league environments
- Derived all six analytical insights — ticket funnel drop-offs, email saturation flags, web bounce patterns, fan cohorts, merchandise underperformance, and market expansion signals
- Treated it like a real engagement — designed the warehouse around the business questions first, then built the data structures to support them rather than building data and asking questions later
- Leaned into realistic imperfection — the simulated data includes the kinds of gaps, inconsistencies, and market variability you actually encounter in a startup sports org, not clean classroom data
- Each insight connects to a decision — every analysis was framed around what a department head (marketing, sales, digital, ops) would actually do differently based on the finding
- Cross-department coverage — intentionally designed to cover every major business function so the dashboard suite could serve as a complete analytics operating layer for a new organization
- Built for executive readability — the Executive Summary page is designed to answer the five questions a league GM asks on Monday morning without requiring any analytical background
Infrastructure first,
then insight
Five stages — building the foundation before the analysis, then connecting every insight to a business decision.
Tools & data model
Four tools and a relational schema diagram showing how the five source tables connect into the analytics layer.


Six questions.
Six decisions.
Every analysis was built around a specific business question — and framed around the decision it would drive, not just the finding it would surface.
Seven pages.
One analytics layer.
Each dashboard page answers one analytical question and connects to the others through shared filters and consistent KPI definitions. Click any screenshot to expand.
The stat sheet
Key decisions & tradeoffs
The choices that shaped how this case study was built — and why each one mattered more than it might seem.
| Decision | Rationale | Tradeoff |
|---|---|---|
| Fan-keyed relational schema | Anchoring every table to a shared fan_id was the foundational decision that made every cross-source analysis possible. A ticket buyer who also opens emails and buys merchandise is one person — the warehouse had to know that. Without it, fan segmentation and LTV modeling would require manual joins on every analysis. | Web sessions nullable — anonymous web traffic can't always be attributed to a known fan. Rather than forcing attribution, web_sessions carries a nullable fan_id, which kept the data honest at the cost of some cross-source completeness. |
| Realistic imperfect data | The simulated dataset was intentionally built with gaps, inconsistencies, and market variability. Startup sports orgs don't have clean data. A portfolio project that assumes perfect data doesn't demonstrate how to operate in reality — it demonstrates how to operate in a classroom. | More credible output — the analyses surface data quality observations alongside business insights, which is closer to what a real analytics engagement actually produces. |
| One page per business question | A 7-page dashboard that answers seven distinct questions is more useful than a single dashboard that tries to answer all of them. Each page was scoped to one stakeholder and one decision — the marketing director doesn't need the ticketing funnel on the same screen as the merchandise breakdown. | Cross-page navigation required — connecting insights across pages requires the user to move between views. For a more integrated experience, a unified cross-filter layer would be a v2 enhancement. |
| Decision framing over data presentation | Every analysis concluded with a specific recommended action, not just a finding. The email saturation insight doesn't end at “send frequency is too high for this cohort” — it ends at “reduce cadence for engaged non-converters by 40% and reallocate send budget to lapsed purchasers.” That's the difference between an analytics report and analytics leadership. | Demonstrates PM thinking — framing outputs as decisions rather than findings is the lens that separates an analyst who reports on data from one who drives business outcomes with it. |