End-to-End
Marketing Analytics
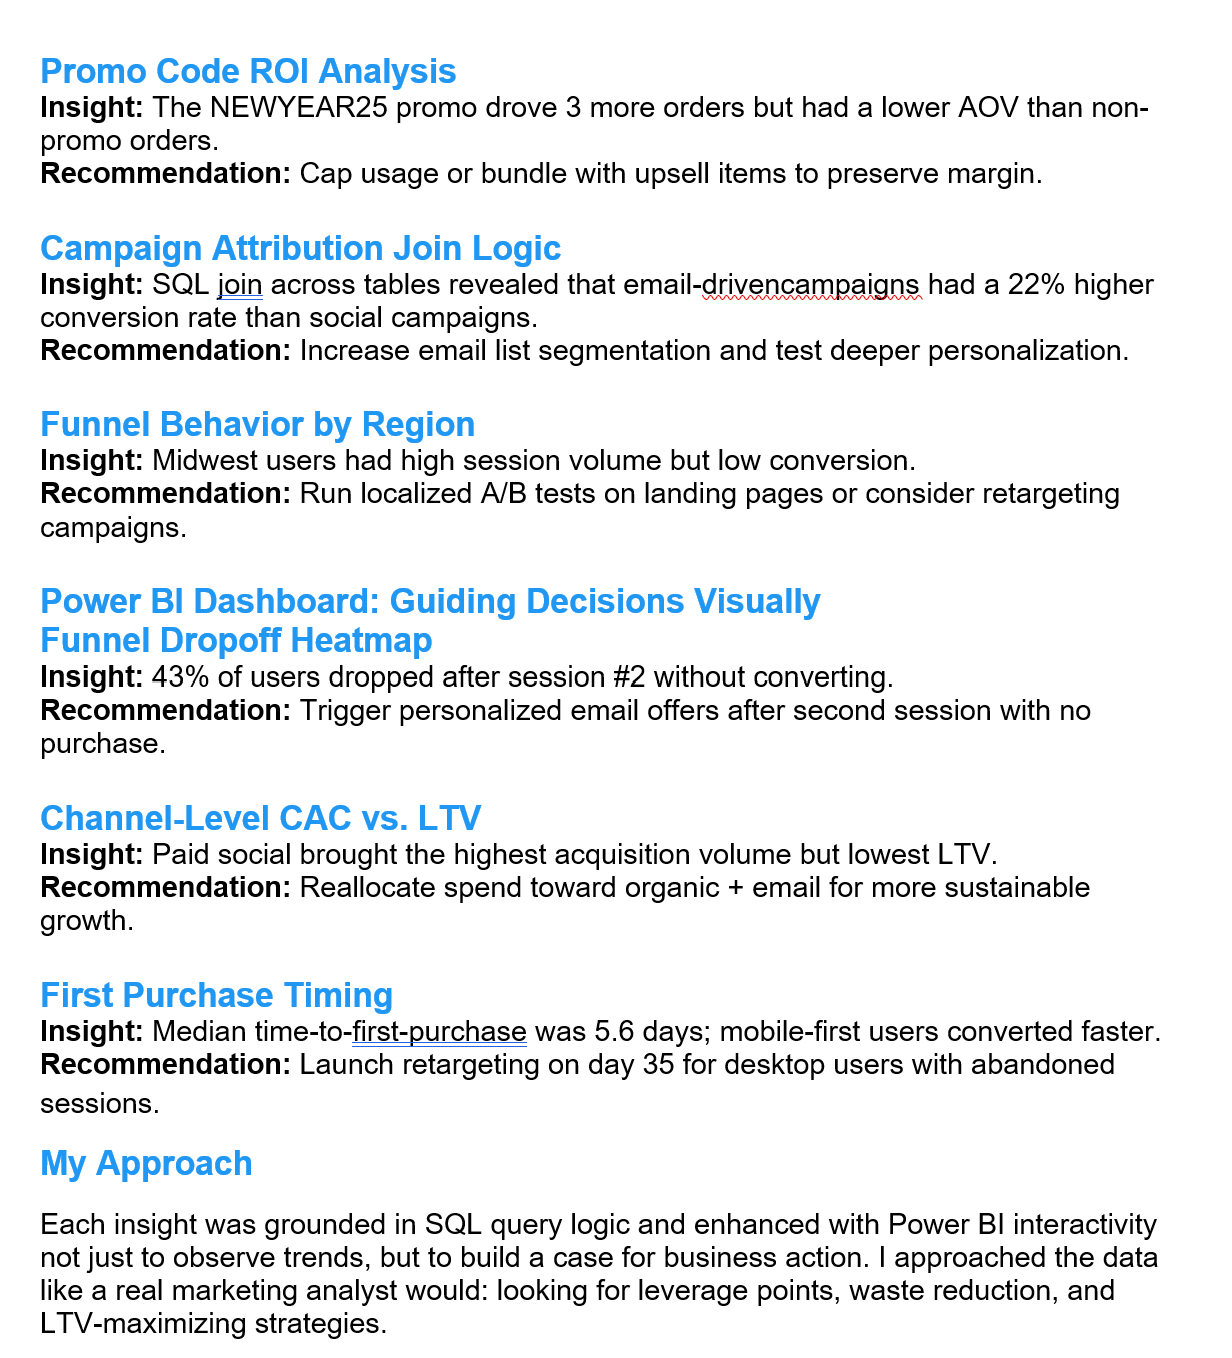
Marketing data that
never connects.
Mobile-first ticketing platforms generate data across every touchpoint — ad impressions, session behavior, promo code redemptions, purchases, and post-sale activity. Each system captures a piece of the customer story. None of them complete it.
Marketing teams end up with attribution reports that don't account for promo impact, funnel reports disconnected from LTV, and campaign ROI calculations that can't be compared channel-to-channel because the underlying data was never modeled relationally.
The result is that decisions about where to spend the next marketing dollar get made with incomplete signal — often optimizing for volume metrics when the actual margin story looks completely different.
TicketPush simulates that environment end to end — schema designed from scratch, realistic data generated via Python, and a four-page Power BI dashboard built to answer the specific questions a growth or revenue team actually asks.
Schema to dashboard
- Engineered the relational MySQL schema from scratch — eight tables, fully normalized, with realistic foreign key relationships across users, sessions, orders, campaigns, and promo codes
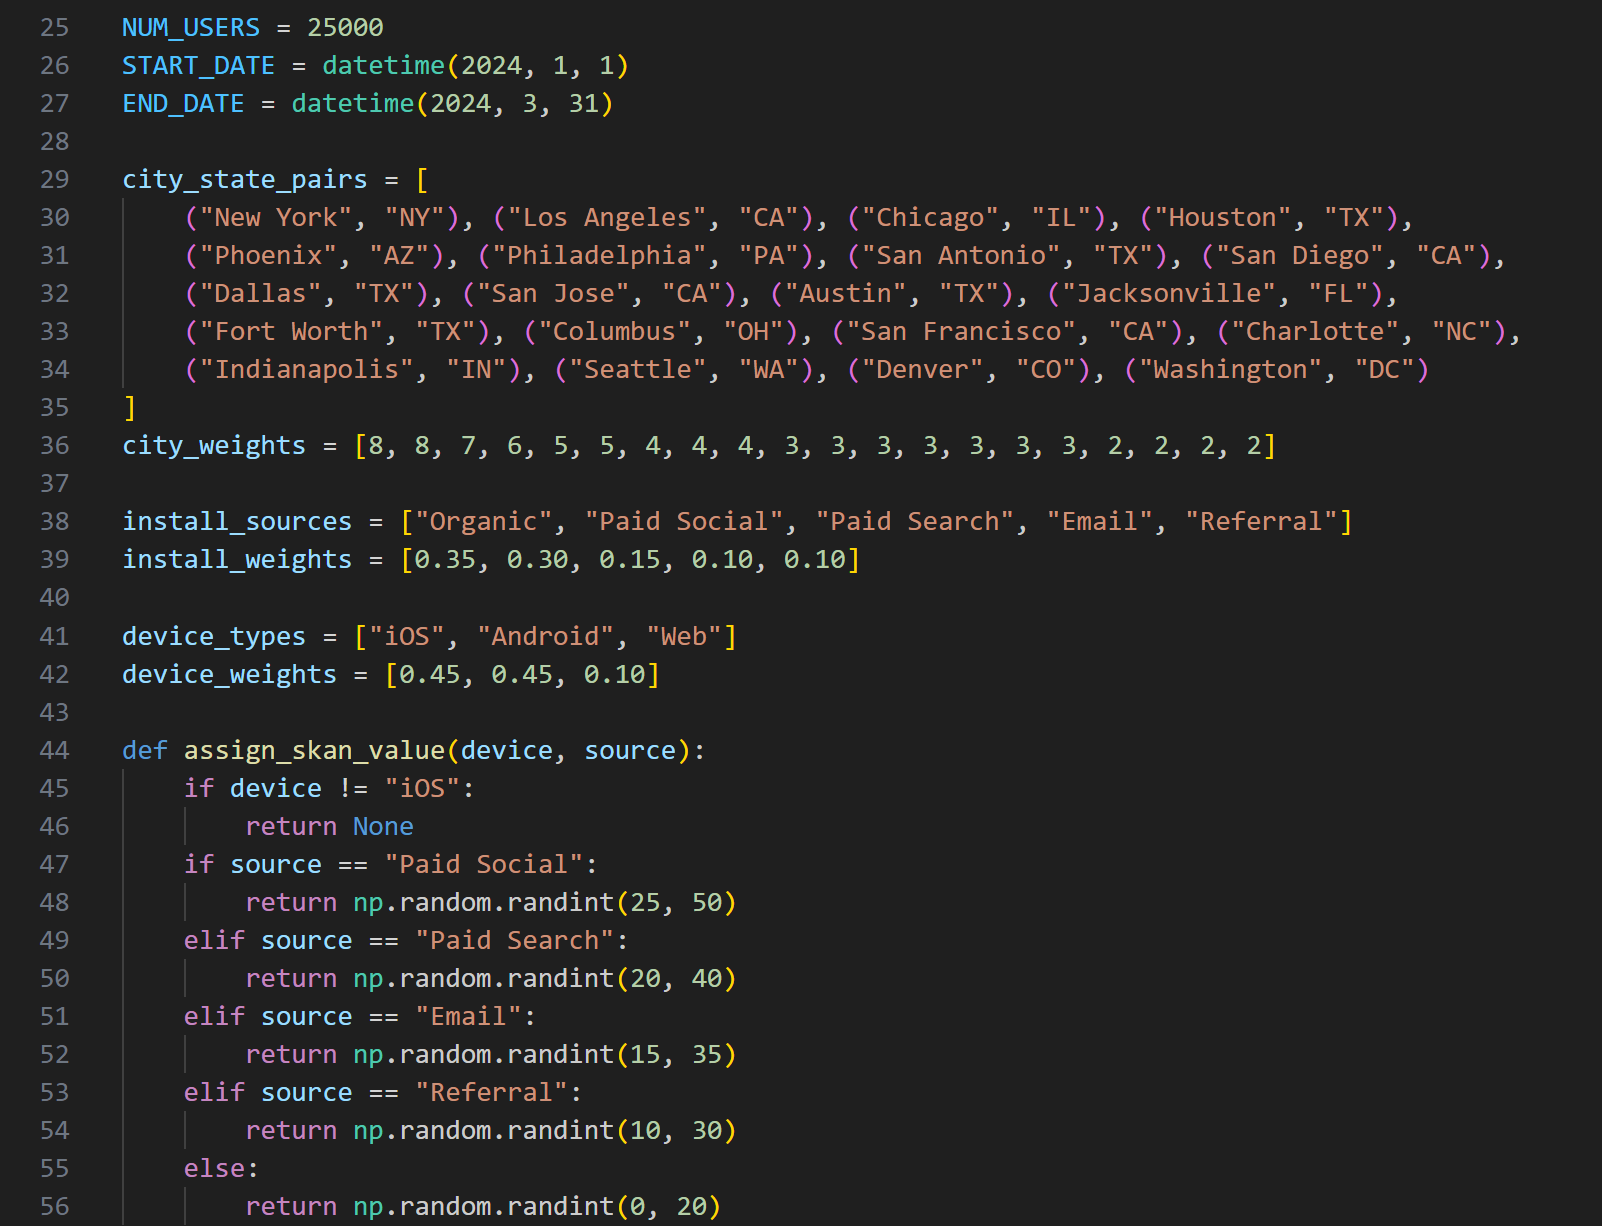
- Simulated all source data with Python — realistic user behavior, multi-channel campaign exposure, promo redemption patterns, and purchase timing distributions
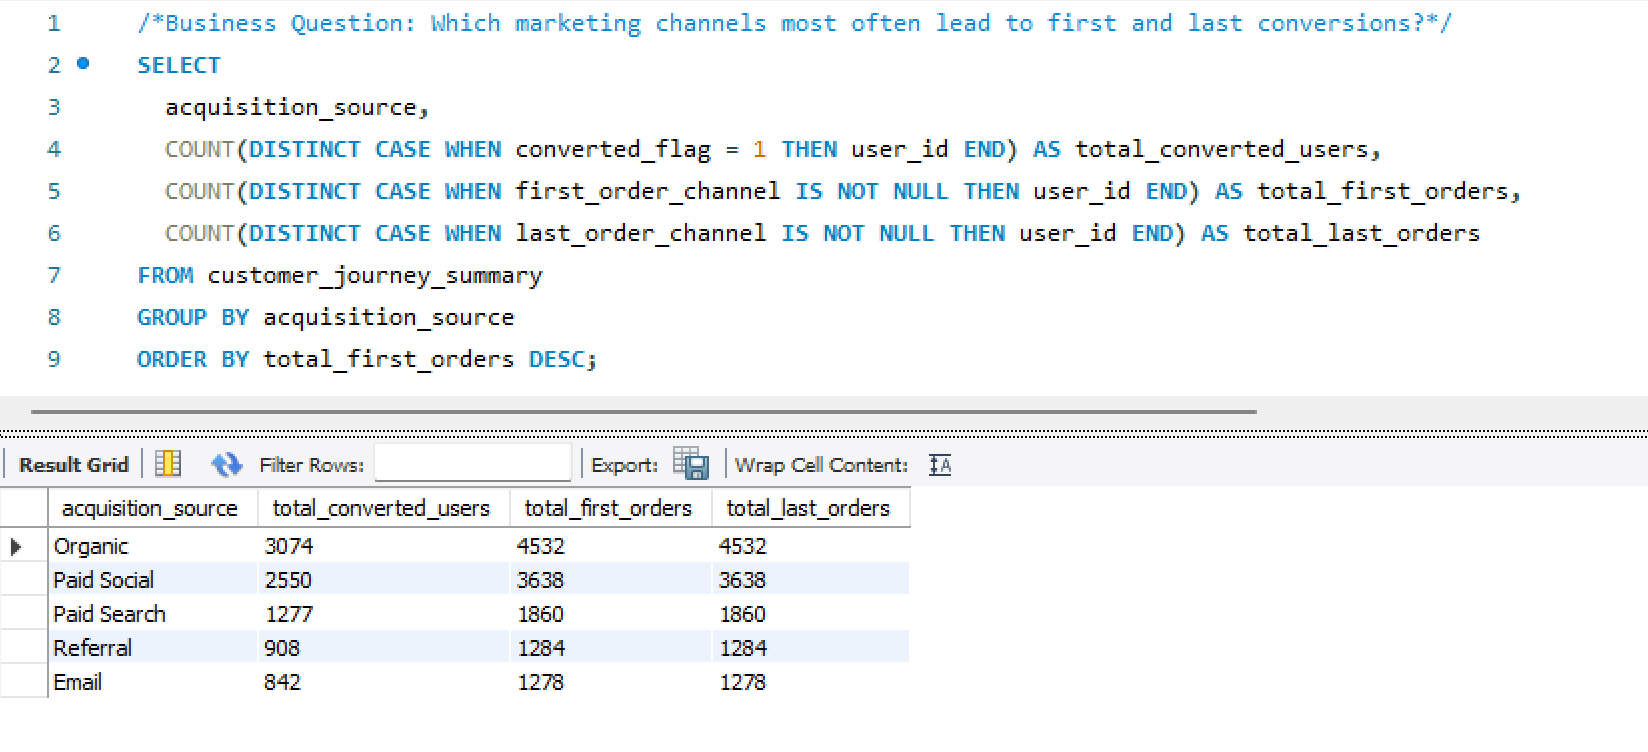
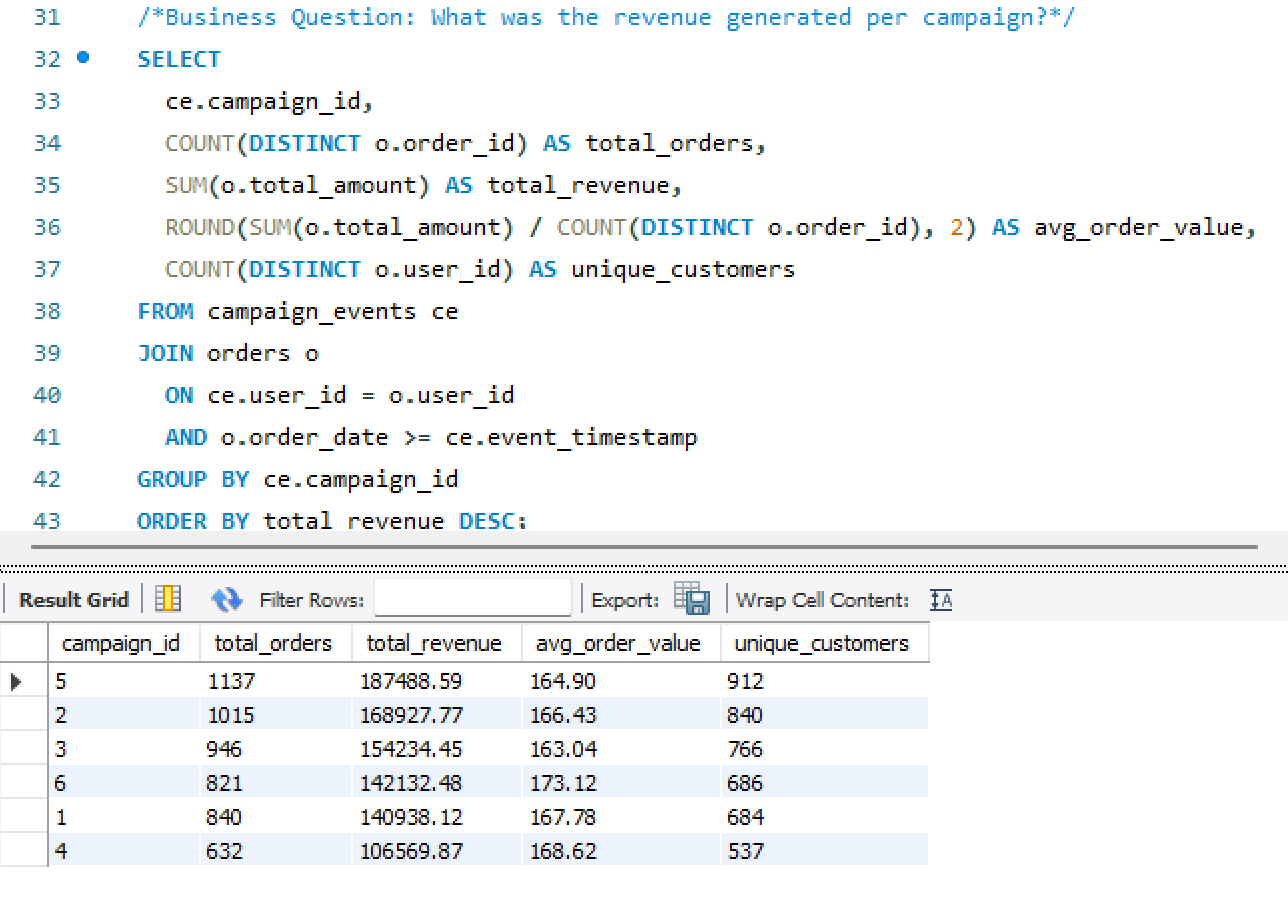
- Built both first-touch and last-touch attribution models — implemented as SQL logic and surfaced comparably in the same dashboard view
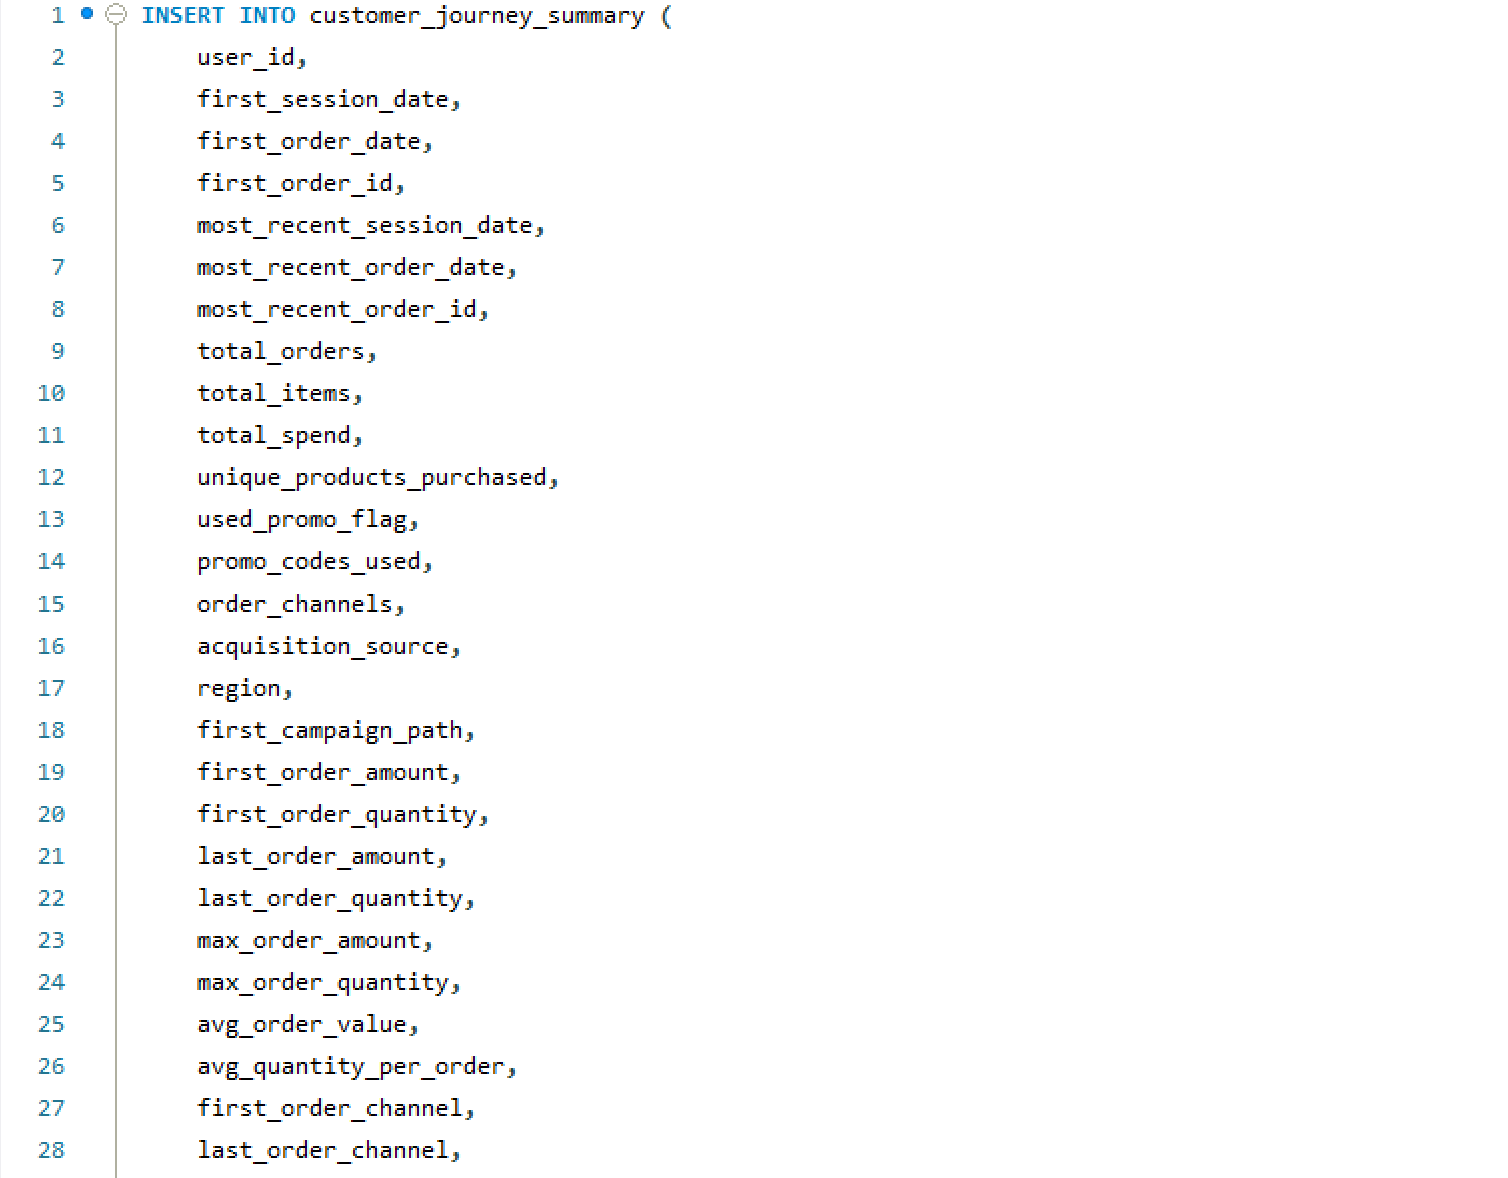
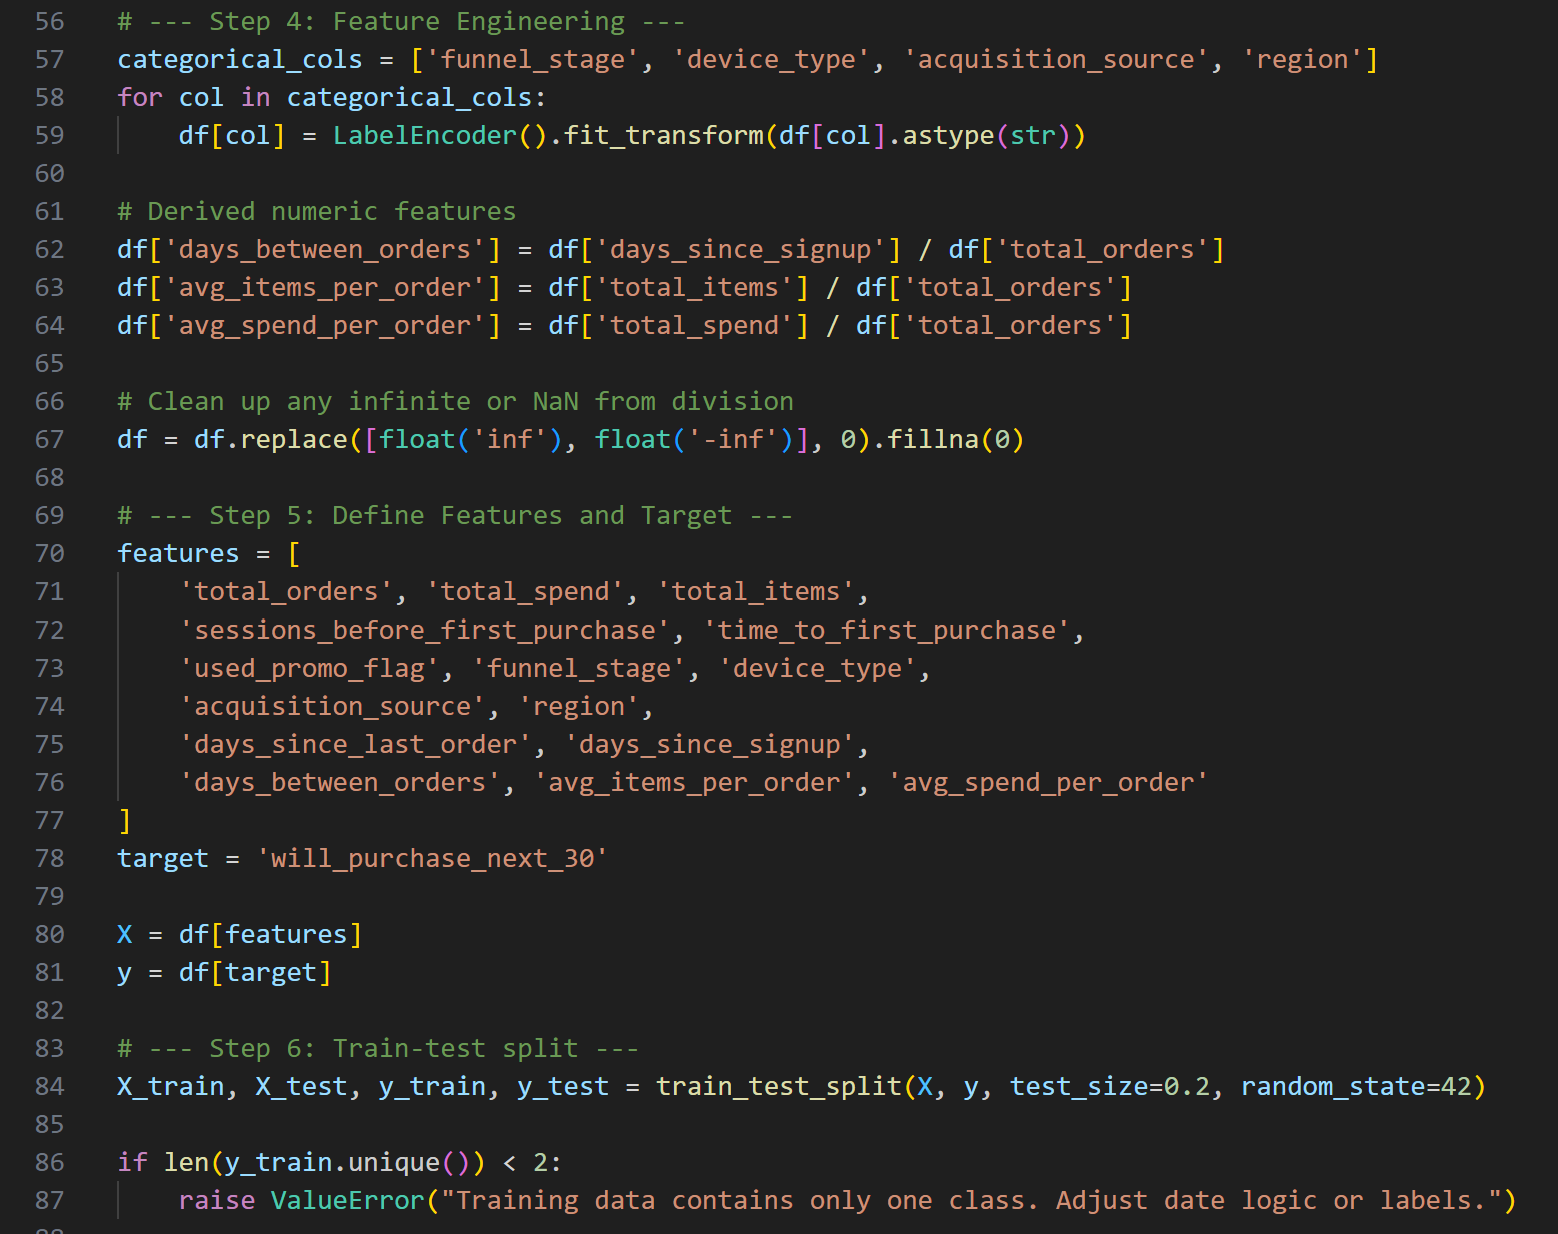
- Created the Customer Journey Summary table — a consolidation layer capturing each user's full lifecycle: acquisition path, funnel stage, time-to-purchase, and repeat risk score
- Designed the four-page Power BI dashboard — each page answering a distinct analytical question with shared filters and consistent KPI definitions
- All data is simulated — designed to behave like a real mobile ticketing platform; not a client engagement or production dataset
- Single-developer build — schema design, data engineering, attribution logic, and visualization all by the same person
- Power BI chosen deliberately — industry-standard for marketing analytics reporting; demonstrates the ability to take SQL output and translate it into executive-ready dashboards
- MySQL over a cloud warehouse — intentional for the simulation context; same schema logic transfers directly to BigQuery or Redshift
- Repeat risk model is behavioral — based on purchase recency and frequency patterns, not a trained ML classifier; noted as a v2 upgrade path
From blank schema
to actionable insight
Five stages — each one producing an artifact that the next stage depends on.
Tools & schema
Four tools, eight tables — and a relational schema diagram showing how the data model connects.


Four pages. One source of truth.
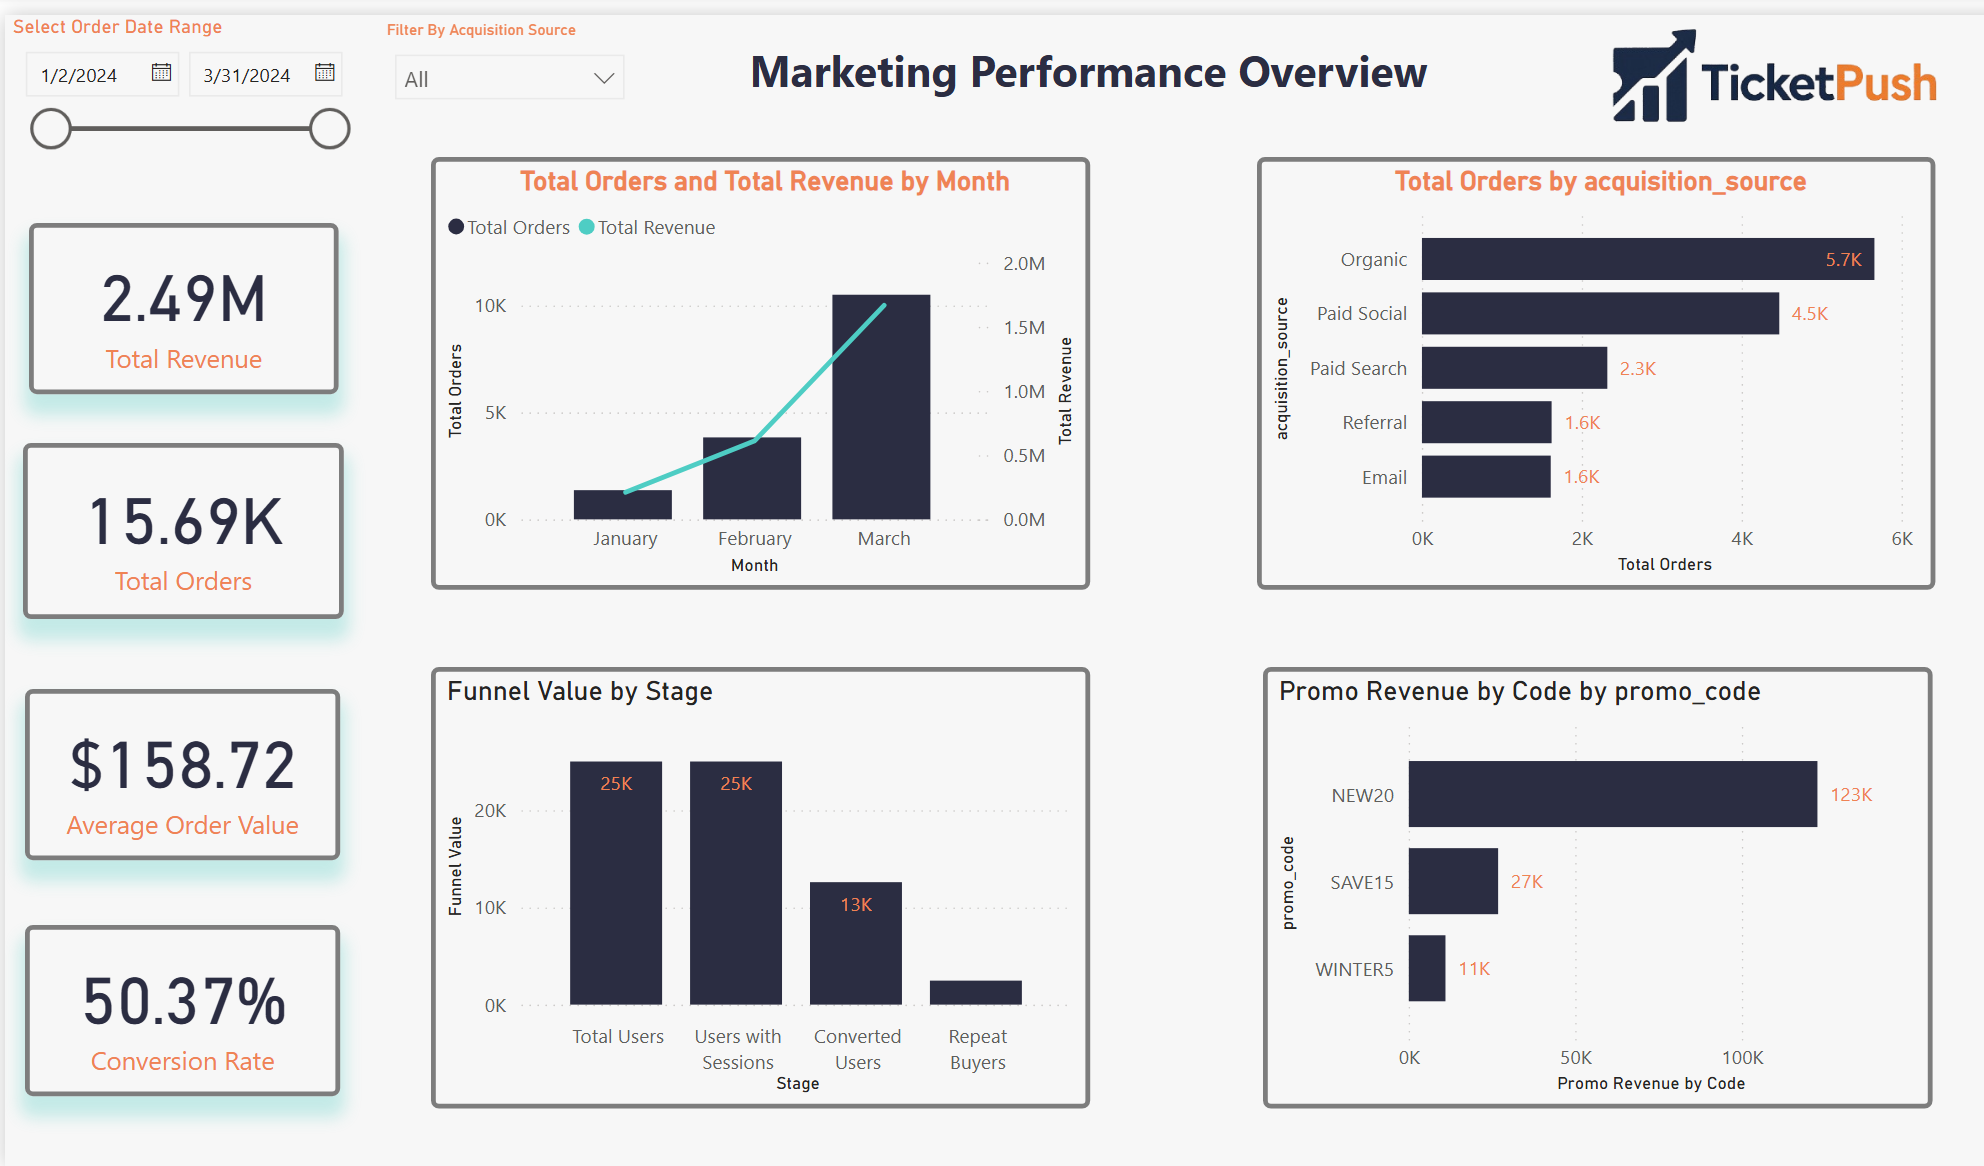
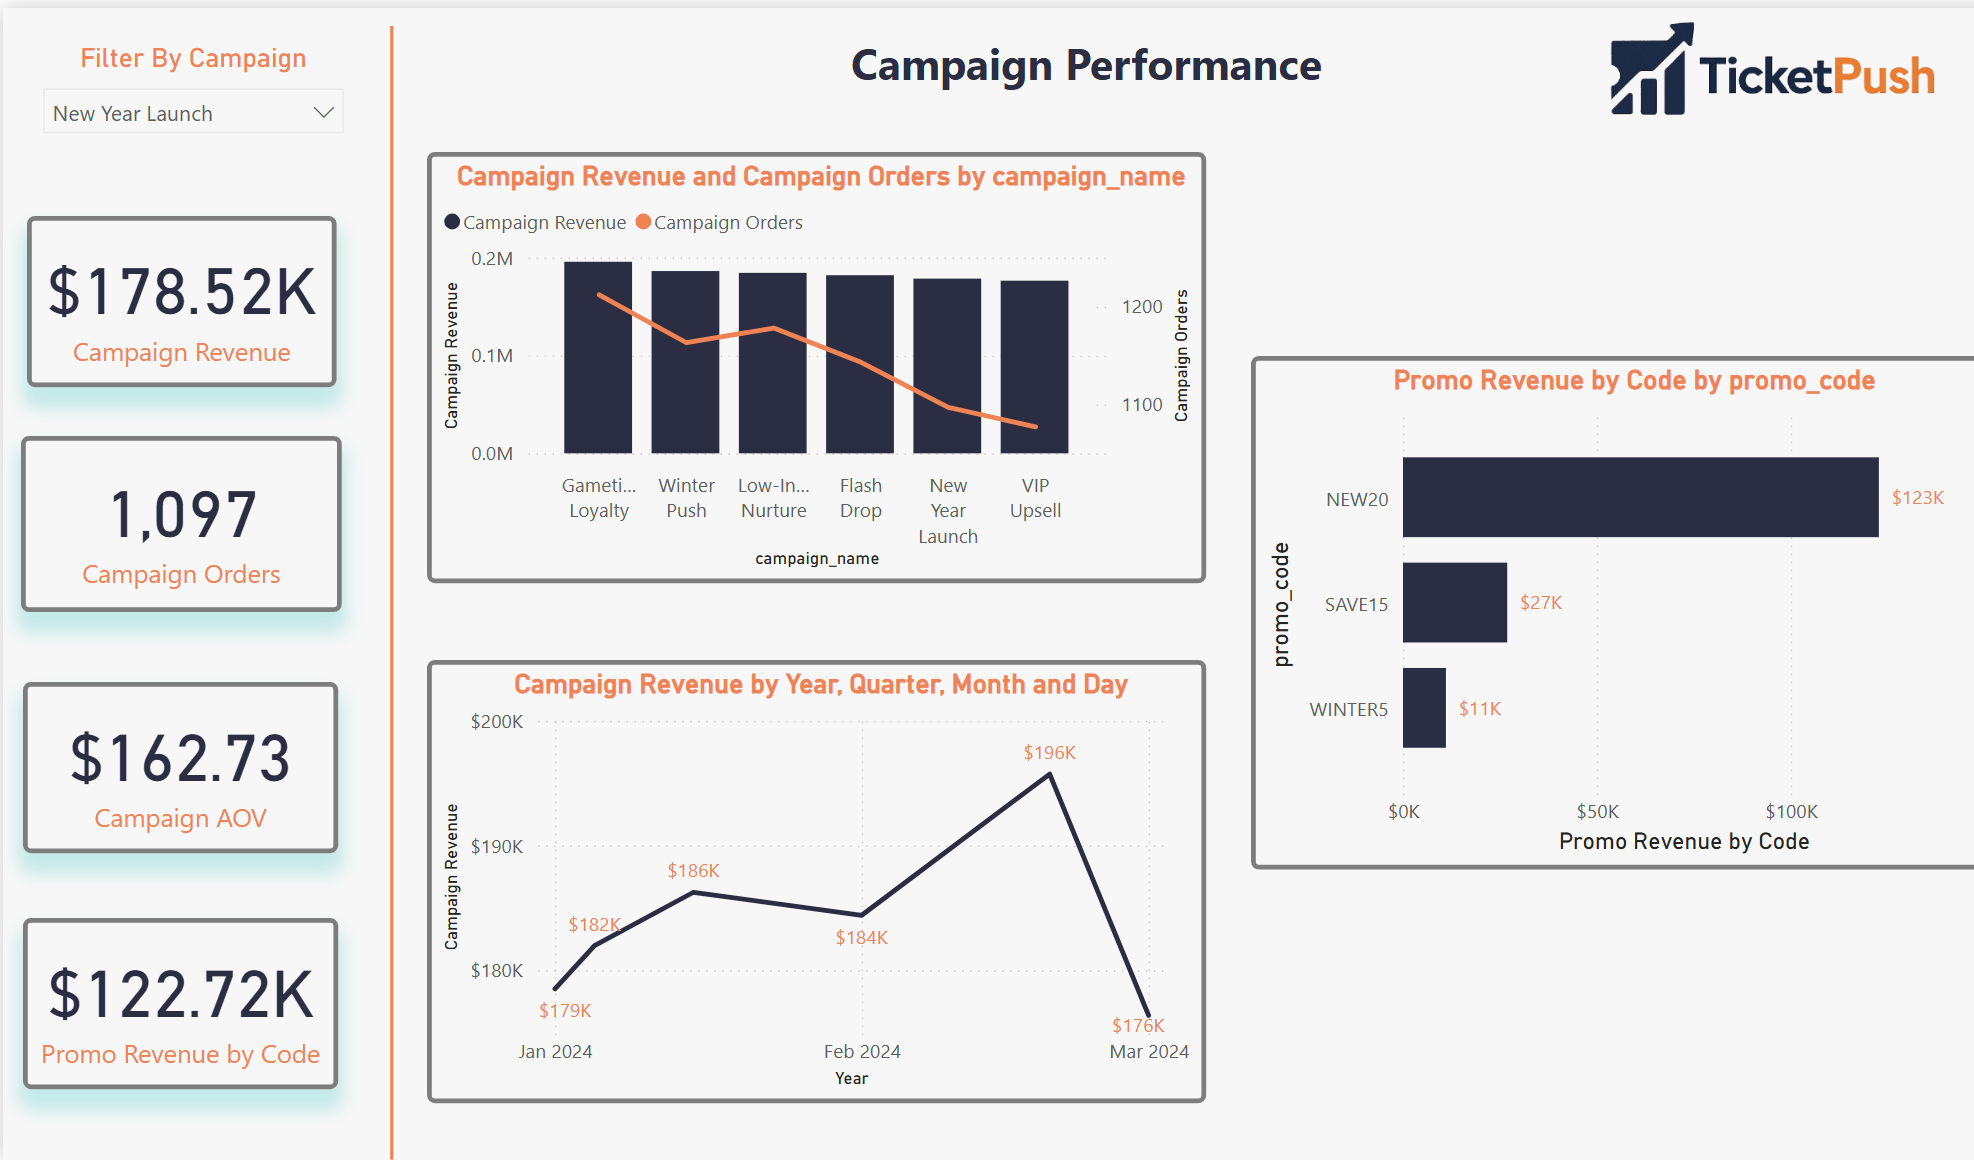
A Power BI dashboard built around four distinct analytical questions — each page answers one and connects to the others through shared filters and consistent KPI definitions.
Pages 03 and 04 screenshots pending upload — placeholders shown above
The stat sheet
Key decisions & tradeoffs
The modeling choices that shaped the output — and what each one cost.
| Decision | Rationale | Tradeoff |
|---|---|---|
| Both attribution models, same view | First-touch and last-touch tell different stories about the same campaign spend. Showing them side-by-side in the same dashboard lets analysts see where they diverge — and where that divergence changes the channel investment decision. | More complex DAX — maintaining two attribution paths in the same Power BI model required careful measure isolation to prevent filter context bleed between models. |
| Customer Journey Summary as a pre-built table | Consolidating lifecycle metrics into a single per-user table makes every downstream query simpler. Without it, the LTV and funnel calculations would require multi-join logic on every dashboard page — adding latency and maintenance risk. | Refresh dependency — the summary table must be rebuilt whenever source data changes. Acceptable for a simulation; in production this becomes a scheduled pipeline job. |
| MySQL over a cloud warehouse | The relational schema logic is identical whether run in MySQL, BigQuery, or Redshift. MySQL was chosen for local development speed and to demonstrate that the analytical design is tool-agnostic — the queries transfer directly. | Fully portable — every SQL file in this project runs on BigQuery or Redshift with minimal syntax changes, making it a genuine production blueprint. |
| Behavioral repeat risk, not ML classifier | A rule-based repeat risk score (recency × frequency) is transparent and explainable. A trained classifier would produce better predictions but would require ground truth labels that don't exist in a simulated dataset. | Lower predictive accuracy — acknowledged as a v2 upgrade path once the dataset has real behavioral history to train against. |
| Python simulation over static seed data | Generating data programmatically means the dataset can be scaled, varied, or re-seeded to test edge cases. It also demonstrates the ability to model realistic behavioral distributions — not just assign random values. | Reproducible and scalable — the simulation can generate 1,000 users or 100,000 users with a single parameter change, making it a proper load-testing environment. |
Screenshot gallery
Dashboard views, SQL logic, and Python simulation — click any screenshot to expand.